● ACTIVE
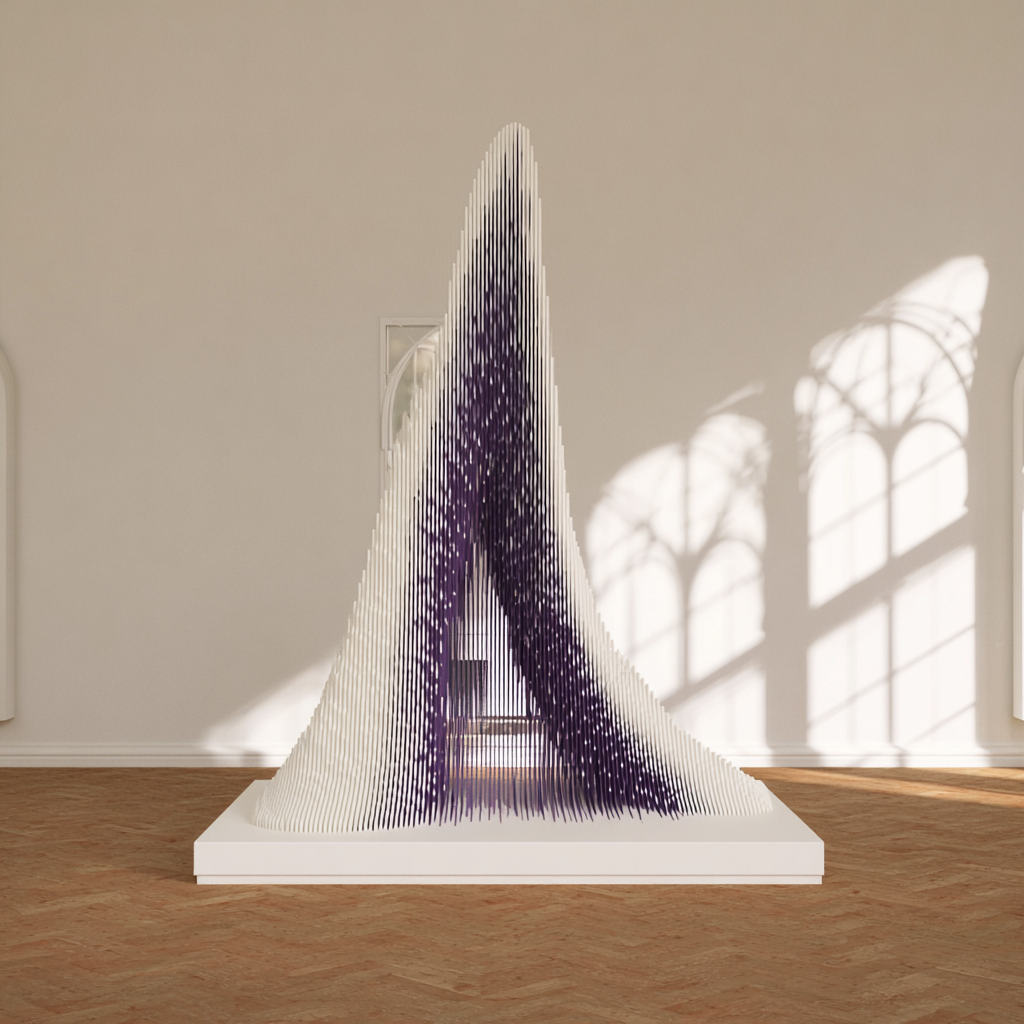
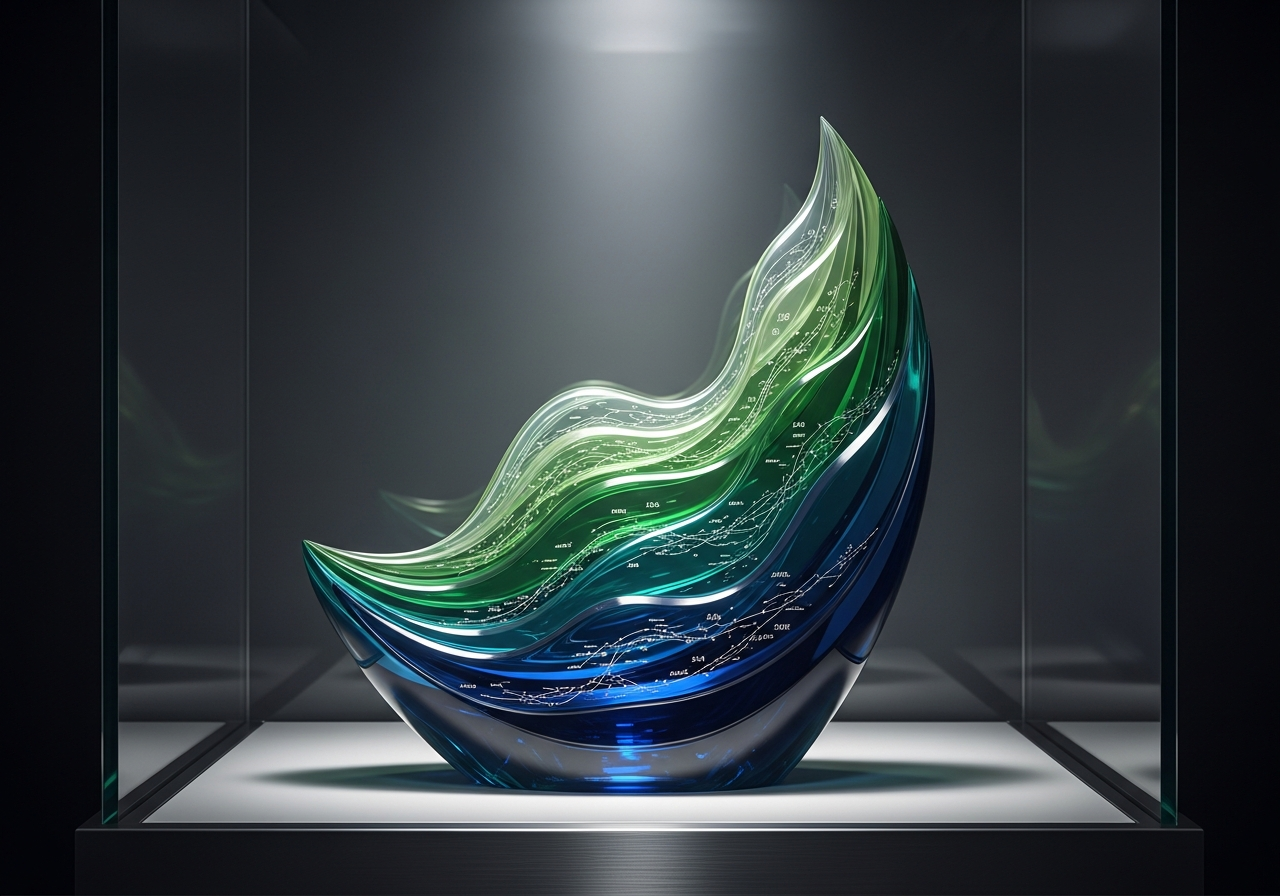
Industry Revenue Growth
Stepped ridges showing sector trends 1950-2025

We transform important data into premium 3D sculptures and interactive models that help leaders explain results, win buy-in, and create impact.
We help organisations understand and communicate complex data by transforming it into physical and digital experiences.
Instead of relying on charts and slides, we interpret your data as 3D models, sculptures, and interactive visuals that make patterns obvious, spark conversation, and support better decision-making.

Executive and board presentations

Investor and stakeholder communication

Sales centres and real estate developments
Exhibitions, conferences, and brand activations
Every project starts with your data and ends with a clear story you can confidently present.
Extend the reach of your data models with immersive display options
For selected projects, we can support immersive pitch formats such as holographic display. This allows digital data models to be presented as floating, three-dimensional visuals in public-facing environments such as exhibitions, sales centres, and conferences. Holographic presentation extends the reach and visibility of the underlying data model while keeping the interpretation, narrative, and sculptural quality at the centre of the work.
Enquire NowTap a model below to explore it in the main viewer
Stepped ridges showing sector trends 1950-2025
Global investment flows by region with live data
Economic history visualization 1970-2023
At The Perfect Pitch, we believe data should do more than sit in a spreadsheet — it should win the room. It should inspire action. Every dataset begins with an idea, but too often those ideas are lost in charts and slides that fail to connect. Our mission is to make data tangible, accessible, and unforgettable.
By transforming complex metrics into elegant 3D models, we turn abstract numbers into something you can see, touch, and share. These sculptures don't just visualize results. They spark conversations, strengthen pitches, and drive real change.
We created The Perfect Pitch to help companies showcase the hard work behind their data in a way that captures attention, builds trust, and makes progress visible. Because when data becomes an experience, it has the power to persuade, inspire, and shape the future.
From concept to creation in 4 clear steps

We analyze your data, understand your story, and define the perfect sculptural approach for your brand.
Our team creates detailed 3D models and mockups, refining every detail until it perfectly captures your vision.
Advanced 3D printing with sustainable materials brings your data sculptures to life with museum-grade quality.
Your piece arrives ready to present, with clear handling, display, and presentation guidance included.
Different organisations need different ways to understand information. Below are common ways clients commission The Perfect Pitch, based on the type of data they need to communicate.

We visualise land value, demand zones, site potential, and future development phases as physical and digital terrain models.
Used by: developers, investors, sales centres

We turn KPIs, growth metrics, and forecasts into clear physical models that support confident decision-making.
Used by: executives, finance teams, investor relations

We create data-driven centerpieces and interactive objects that turn campaign results into memorable experiences.
Used by: marketing teams, agencies, conferences
We interpret sustainability and impact data to show progress and targets in a way that builds trust.
Used by: banks, corporates, ESG teams

We translate market positioning and competitive dynamics into visual forms that make strategy clear.
Used by: strategy teams, consultants

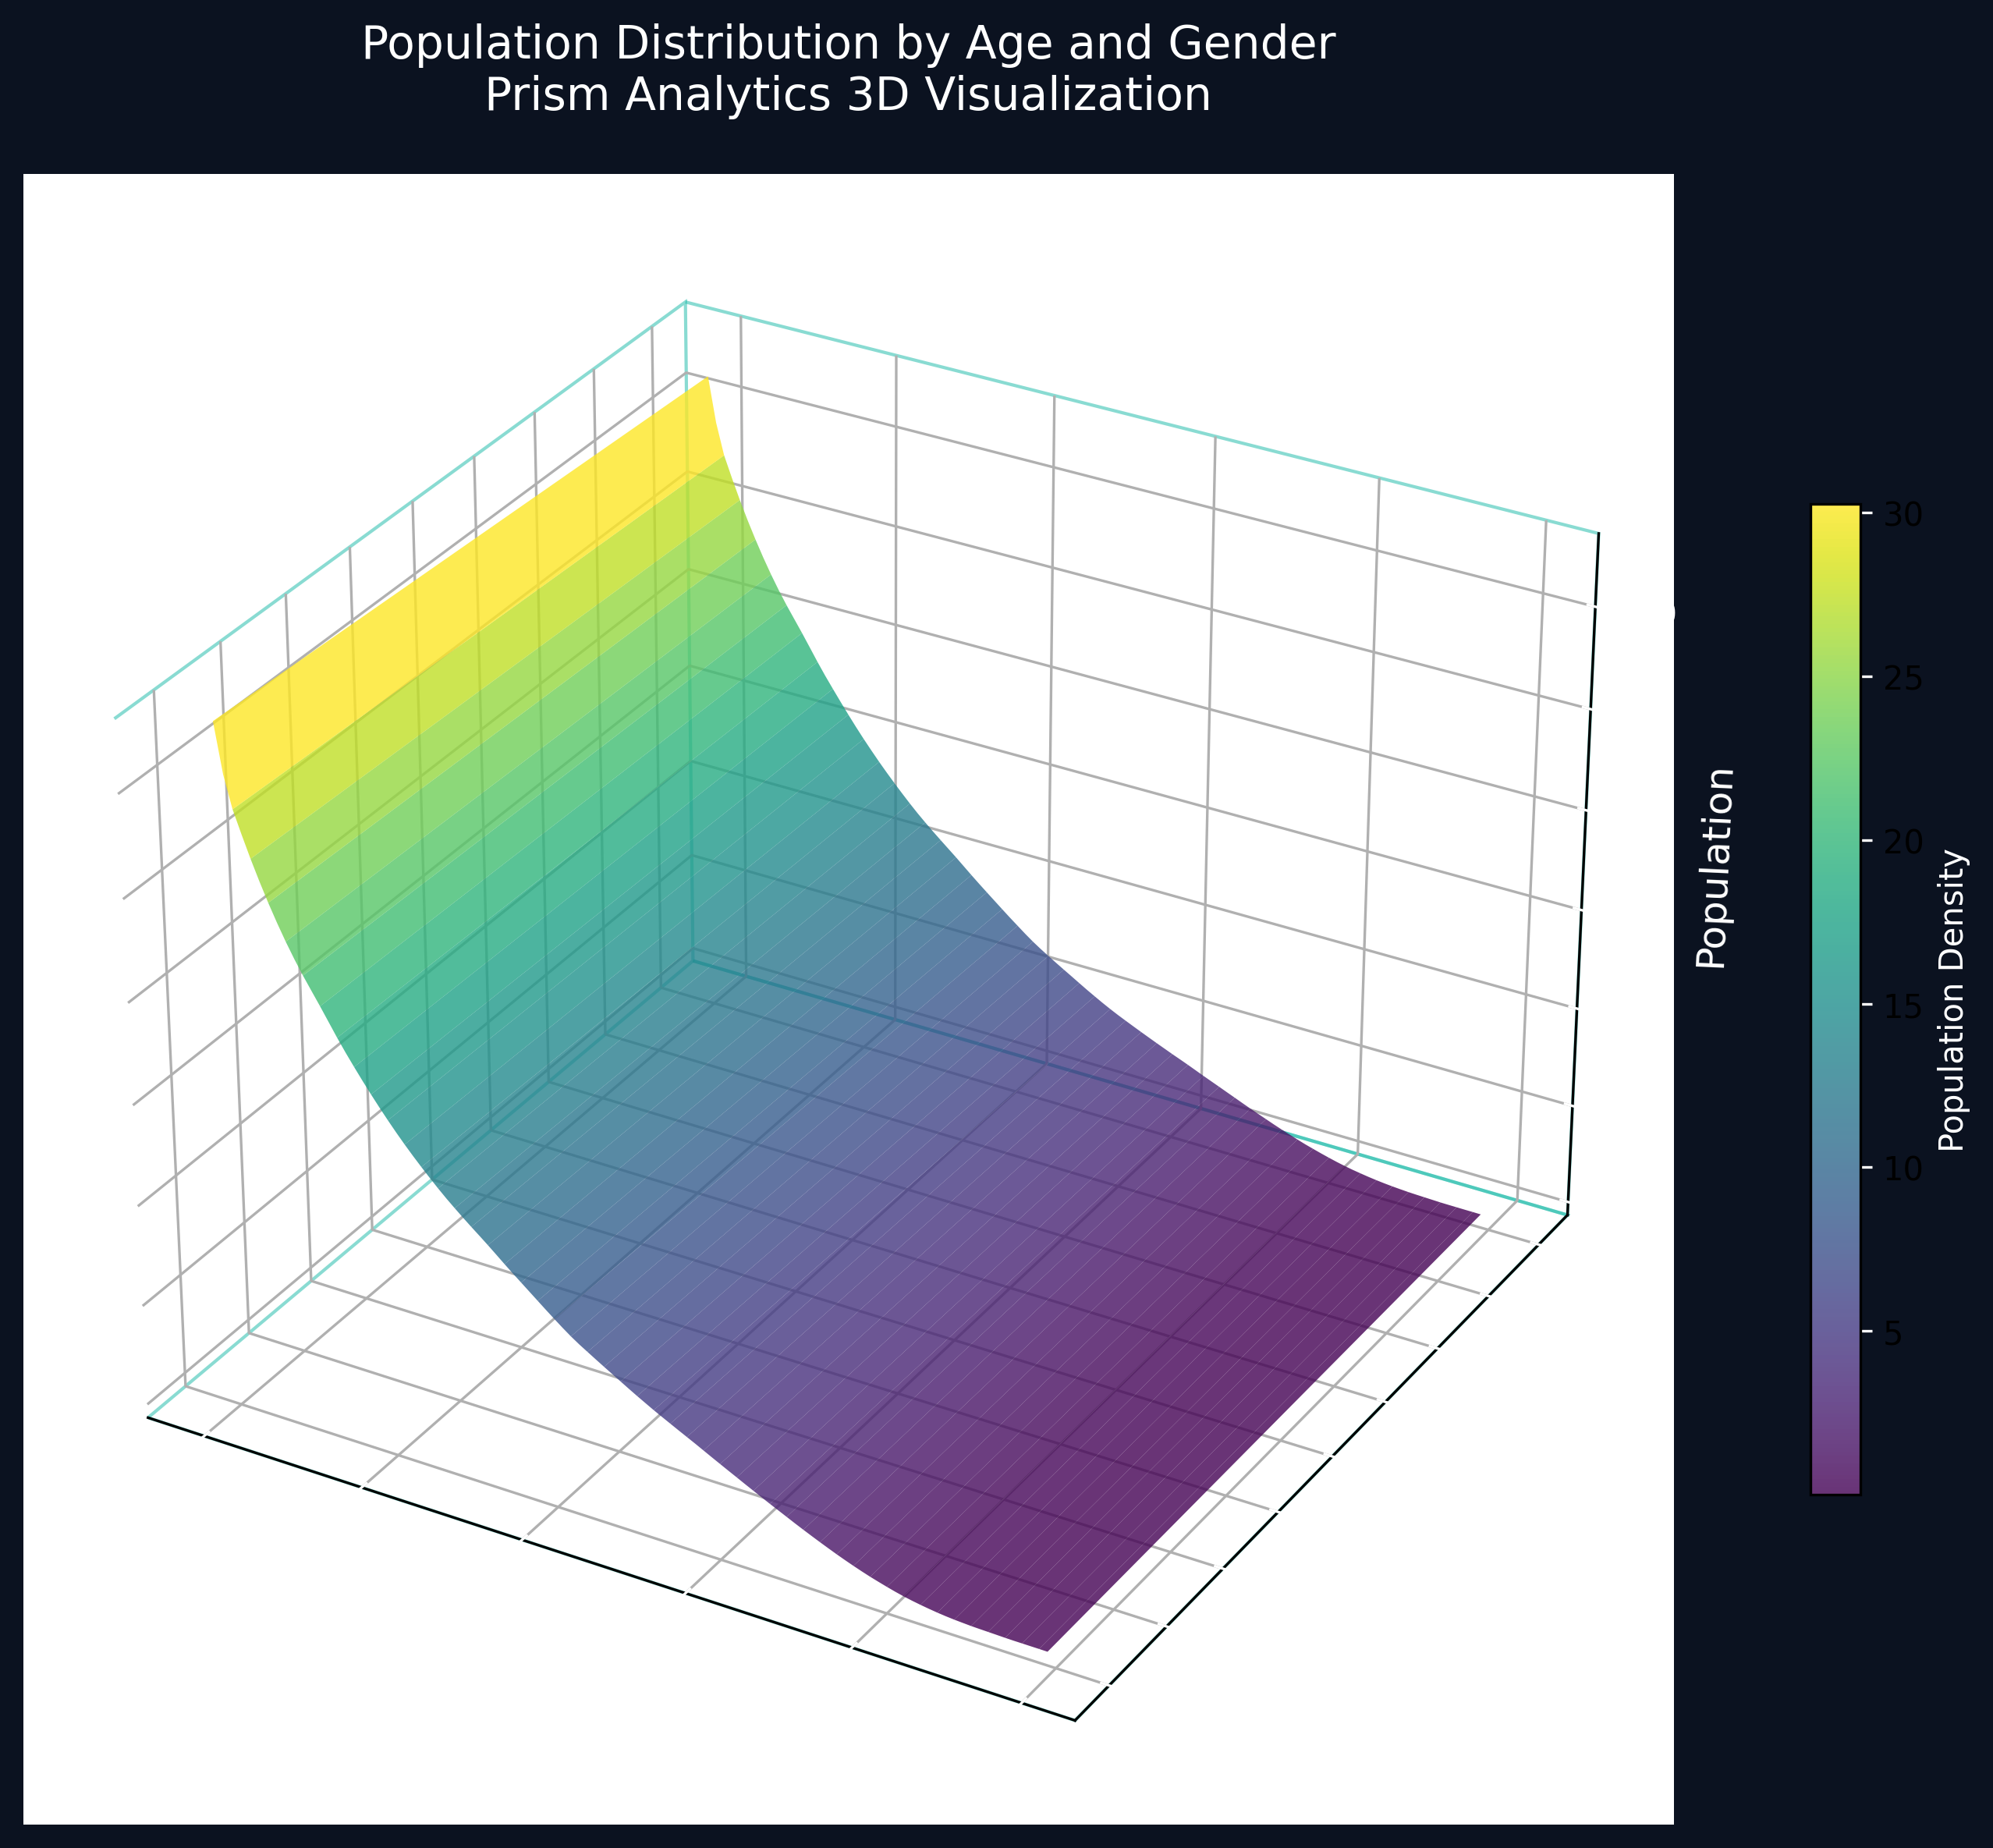
We represent population growth, density, and demographic shifts using stepped and layered sculptures.
Used by: UN agencies, governments, research teams
We visualise access, distribution, and imbalance to support communication around humanitarian challenges.
Used by: NGOs, humanitarian organisations

We explore patient journeys and outcomes through models that make complex health data more readable.
Used by: healthcare organisations, research teams
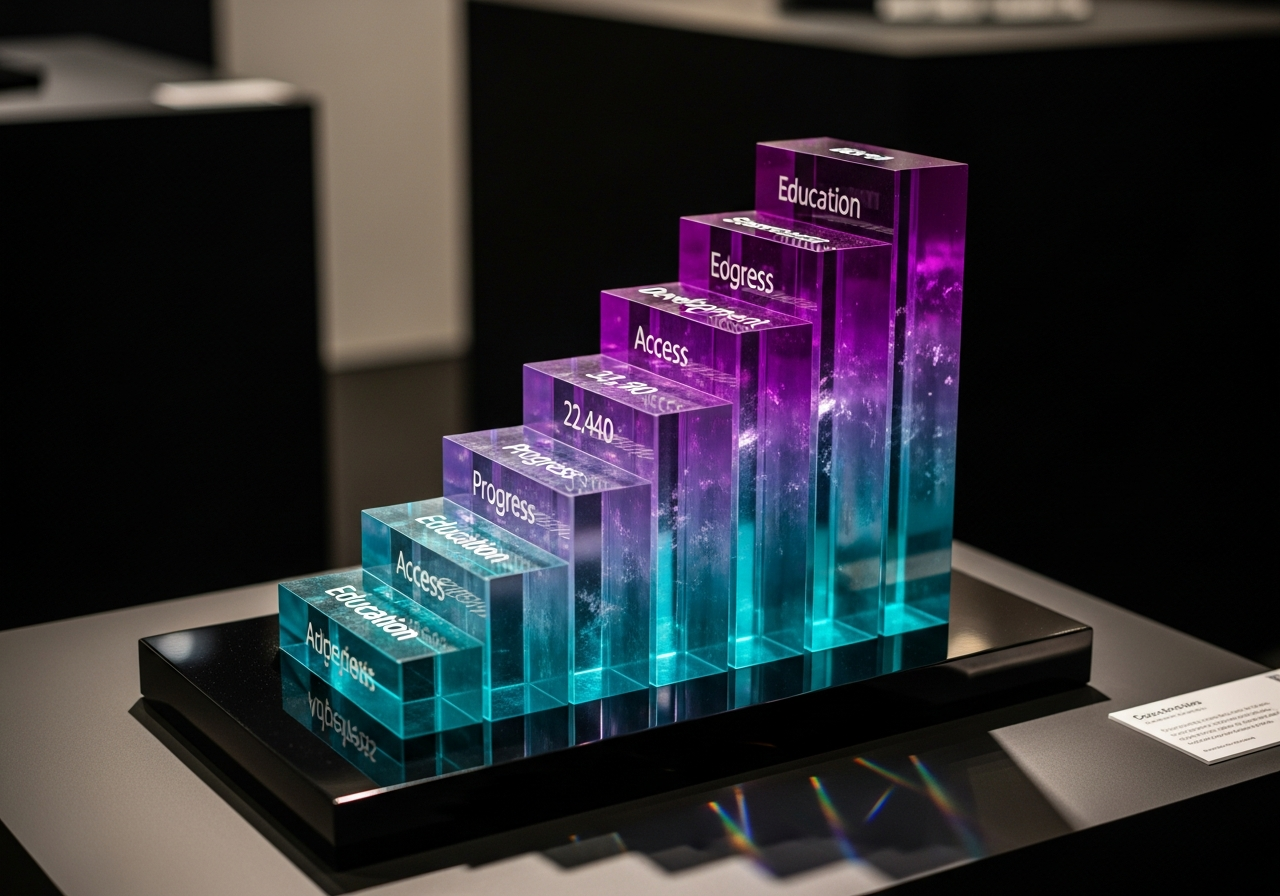
We turn progress and access data into tools for education, training, and public engagement.
Used by: foundations, ministries, NGOs
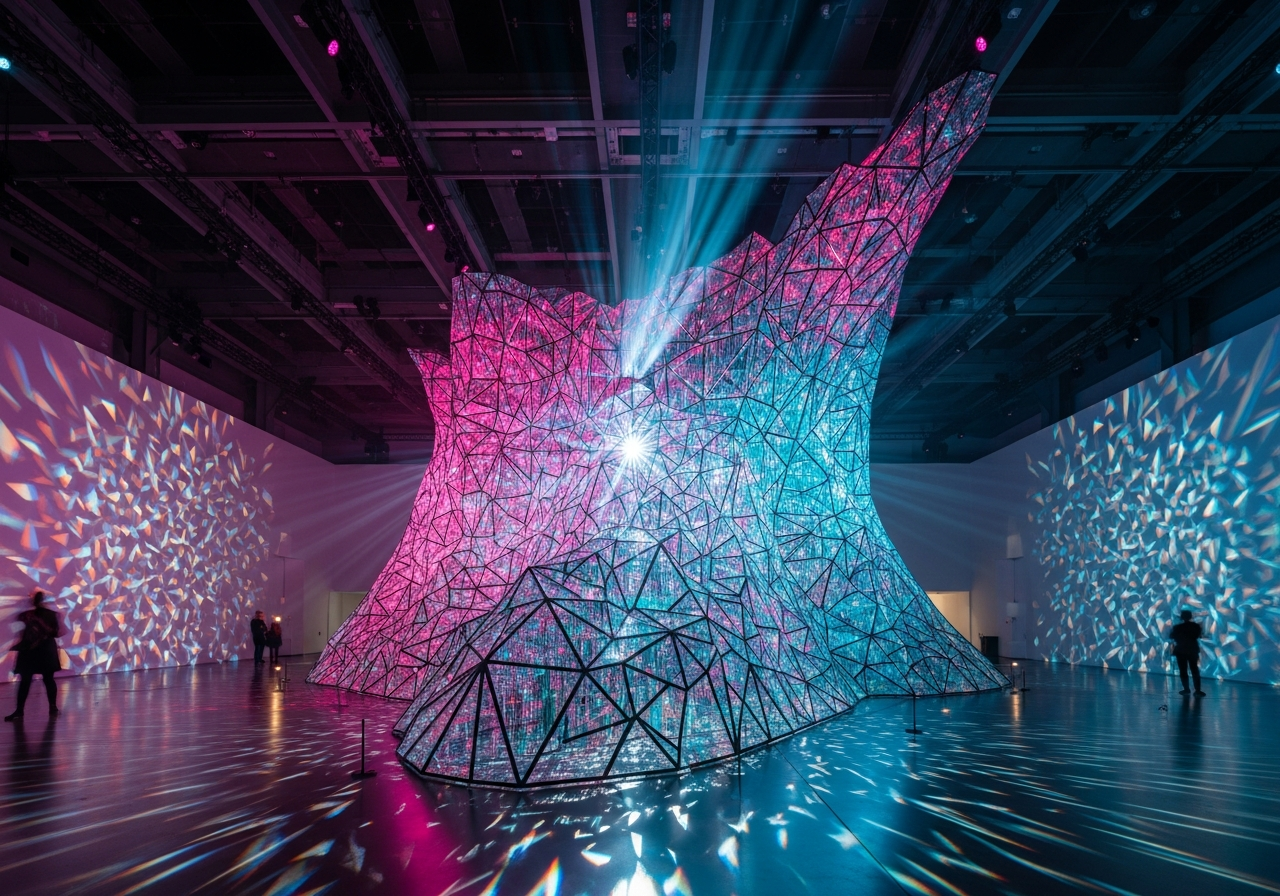
We design large-scale pieces that help public audiences understand complex topics quickly.
Used by: museums, cultural institutions, public programmes
Choose how deep you want to go. Each package is designed to turn your data into a clear story you can present with confidence.
You can apply any package to the use cases above.
2026 Launch Sale – Limited Availability
A focused entry point for teams who want one dataset turned into one clear, tangible insight.
Interpretation of one dataset
One physical data sculpture (standard size)
Digital interactive preview
Short written insight summary
One revision round
2026 Launch Sale – Limited Availability
For teams who need multiple perspectives and a clear narrative around their data.
Two to three data interpretations
One or two physical data models
Digital interactive previews
Presentation-ready talking points
Two revision rounds
For public-facing projects, exhibitions, and large-scale activations.
Concept and narrative development
Large-scale or multi-piece sculptures
Digital models for display screens
Installation and presentation guidance
Selected projects showing how The Perfect Pitch translates complex data into physical and digital experiences.

We transformed demographic datasets into stepped 3D sculptures that make long-term population change instantly understandable.
These models support discussion, education, and public engagement by allowing audiences to see and compare change over time without relying on charts or technical explanations.

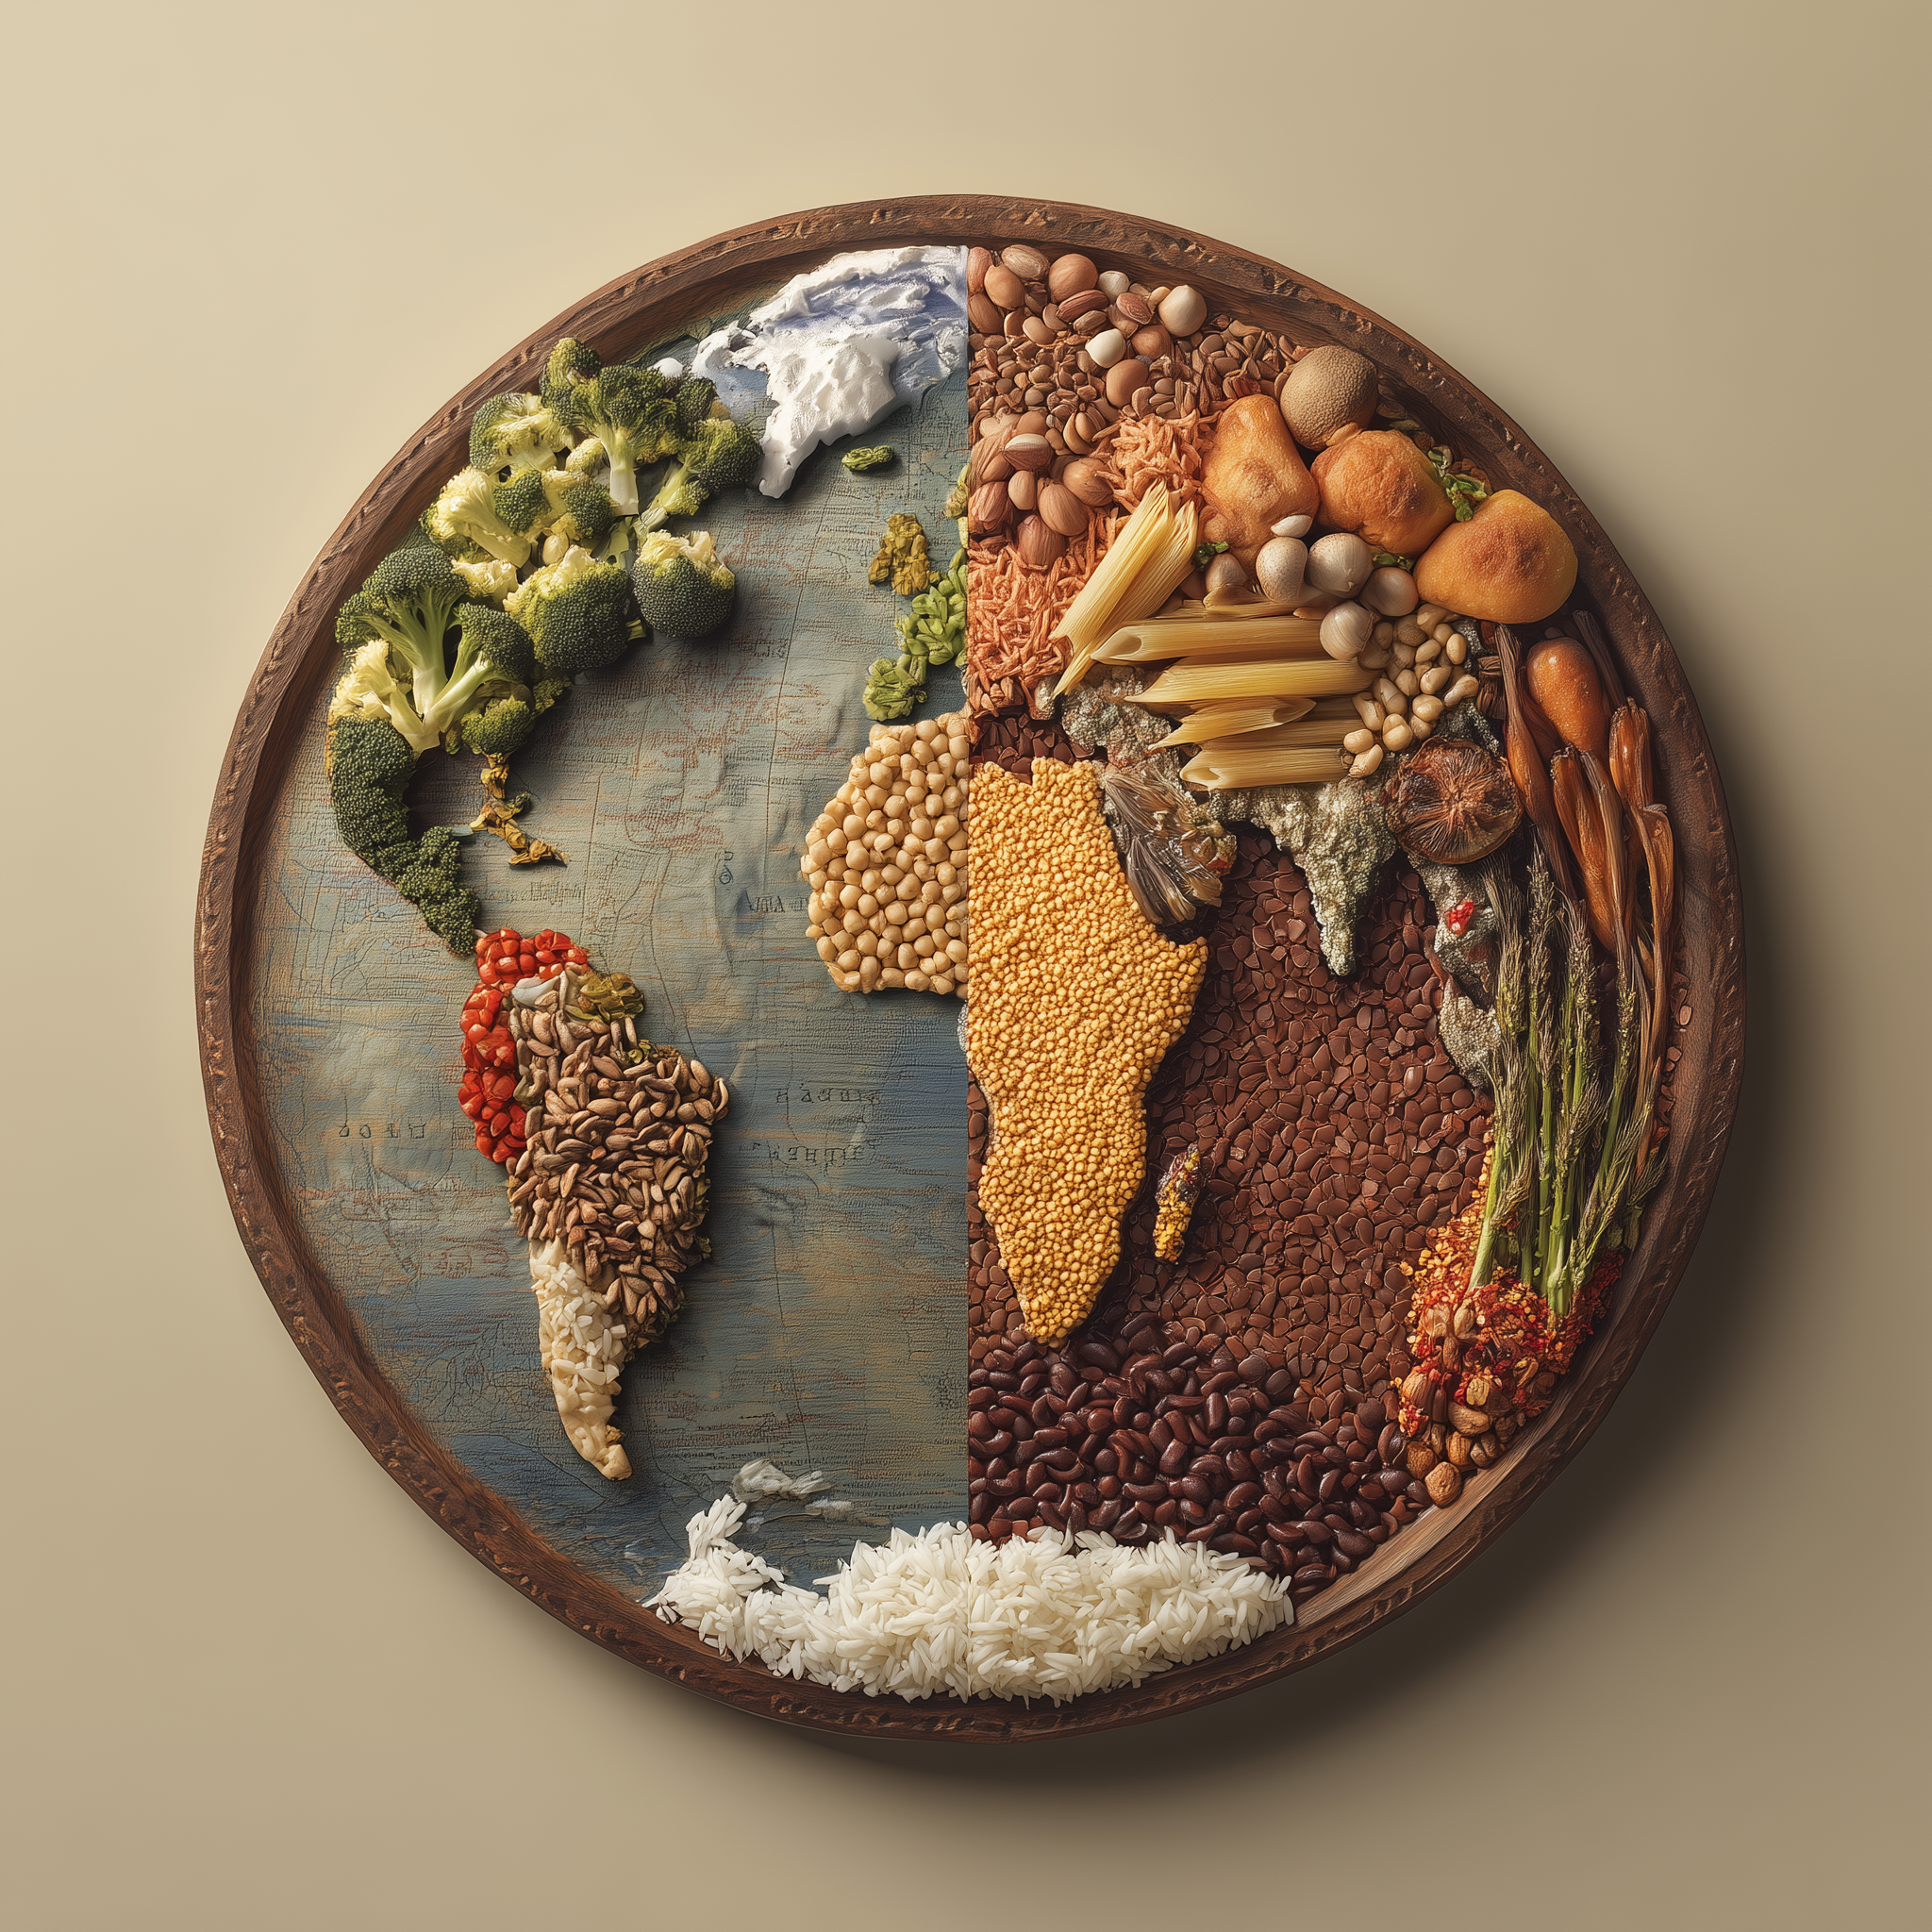
We explored ways to interpret food security and distribution data through visual models that highlight access, imbalance, and urgency.
The work supports clearer communication around humanitarian challenges by turning abstract numbers into tangible reference points.
Design and preview your data sculptures with advanced 2D visualization tools. Perfect for quick prototyping before 3D printing.
CSV or Excel files
Click or drag here
• Preview: Interactive 3D rotation, zoom, pan
• STL: Watertight geometry for 3D printing
• Colors are preview-only; STL exports geometry
Upload data to see your model
Supports CSV and Excel files
Upload your CSV or XLSX data and see it transformed into stunning 3D visualizations instantly. Experience the future of data storytelling.
Drop your .xlsx / .csv here
or click to browse
Right-click → "Save As" to download files
Transform your data into something you can touch
We'll respond within 24 hours with a custom quote and availability.
Having trouble with the form?
Email us directly at: info@prismanalytics.xyz
Or WhatsApp us using the green button on the right →